
Statistics
Often on the news, we hear such words as:
"The average …"
"One out of … do/have …,"
"There is a ... percent chance for ..."
But what does all it mean, really?
The world of statistics can be a complex world full of numbers, but it can give us insight and the guide decisions we need to make.
But statistics can also be used to trick and fool.
So, what is statistics? Go grab your calculators and come find out.
What's it all about, … most likely
“Tis impossible to be sure of anything but Death and Taxes.”
This statement may be a bit cynical, but it makes a point that, while some things can be certain, many things in life are not. How do we manage this uncertainty? And related to this, how do we make sense of the differences in measurements this uncertainty causes?
This is where statistics come in.
Statistics is a large branch of mathematics that covers a wide range of topics, involving a never-ending list of formulas used over a wide range of uses. Trying to cover all of it in this blog doesn't make sense. Instead, let's look at a couple of ways statistics gets used, just to get a good flavor of it.

Chances are
The way we measure how certain we are that something will happen is by probability. A probability of zero means something has no chance of happening. Some examples of zero probability are that ...
you will flap your arms and go to Mars.
you will roll a 27 with a standard six-sided die.
a gopher will dig a hole down to the center of the Earth.
A probability of 1 (or 100%) means the outcome must happen. Again, here are some examples:
The Sun will rise in the morning.
If you put a normal log on a fire, it will burn.
If you drop a rock, and it will fall.
In between these values, all that can be said with certainty is the outcome being spoken of may or may not happen. Hardly brilliant.
So what's the point?
There are a couple of useful ways to look at it.
At any rate
One way to look at probabilities is to see how many times one can expect an outcome to happen. For example, suppose that the probability (or chance) of being dealt a particular card type is one in four (¼, 0.25, or 25%). So, one would expect, after being dealt four cards, to have this particular card once. Be dealt 20 cards and we would expect about five to be our cards. If it were 40, then 10 cards.
Of course, that's just a projection – statistics is no fortuneteller. You might get two, three, four, or none of these cards. Still, we have some idea of how many we might see. Also, the more cards that get dealt, the better this expected value becomes.
Note: The gambler's fallacy:
A common mistake made by those gambling comes after they had a streak of losses. It is thought that the chances for a win must catch up with them, so the chances of winning the next round must be higher. The truth is each game or risk is its own deal; what went on before does not change anything.
Going forth with confidence
Years ago, a friend of mine said a person could go to a place that rains about 36 days a year (10% of the days in a year) and go through their career every day saying there is a 10% chance of rain. The rate is right on, but what does that really mean to anyone listening?
The higher the probability of something, like rain, the more likely it will happen. We can use this as a guide. A 10% chance of rain might mean you can leave the house without worrying about getting wet, but a 70% chance means you probably should take an umbrella. Of course there are no guarantees. A 10% chance still means it could rain.

Likewise, a 70% chance could still be dry.

Note: The old story of the math genius wins at gambling:
One of the stock plot ideas often used in movies is the math genius who, using his knowledge of statistics, wins at every game at a casino. Wrong. As stated earlier, statistics can only guide the actions to give the best chance of winning, which can help in the long run. But winning every time? Possible, yes. Likely, no.
Doing the math
So how do you find out what the probability is? There are two ways to do this.
Show me the numbers
Figuring out a probability is simple if you think of it as a rate.
Suppose someone counted 29 rainy days during a single year (365 days total). What is the probability that any given day was rainy? We can find out by comparing the days it rained with the total. Simply divide the two.
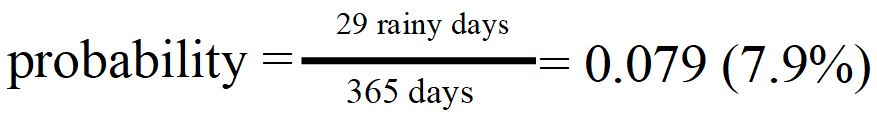
So, there is a 7.9% chance of rain on any given day. With such a low probability, a person could go outside with little concern about rain (if this is a typical year). Indeed, with only 29 days a year of rain, one might figure this out anyway.
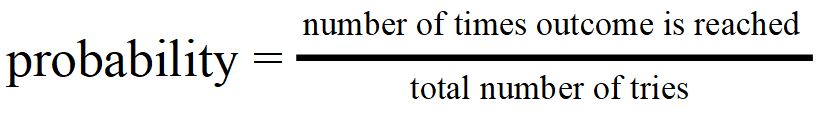
In general then, one can calculate the probability by comparing the number of times something of interest happened with the number of times it was tried to reach it.
Simply divide the number of times you see the desired result by the total number of tries.
Making a prediction
If all possible outcomes are just as likely, this idea of a rate can be used to predict probability.
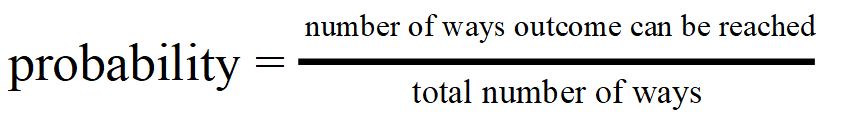
For example, what is the probability of rolling a four with a standard die?

There is only one way to roll a four, and that's by rolling a four. On the other hand, there are six possible numbers that you can get. This means the probability is 1/6. This means you might expect to roll a four about a sixth of the time.
Another example along this same line is the probability of rolling an even number (2, 4 or 6) on a standard die. There are three possible chances to roll an even number, rolling a two, four or six. There are then three chances out of six total possible rolls. The probability is 3/6 or ½. This means that after a lot of rolls, an even number will pop up about half the time.
The mean streets
Another way we use statistics is exploring the middle of a group of numbers. This is where the average or (using proper terms) the mean of a set of numbers come in. Finding the average is a simple matter, add up all the numbers and divide by the number of numbers. In this way, the higher numbers are balanced out with the lower numbers. What's left over is something like a middle number.
Take the following set of numbers: 11, 16, 9, 1, 7, and 4. To find the average, add all the numbers and divide by how many numbers there are. In this case, there are 6.
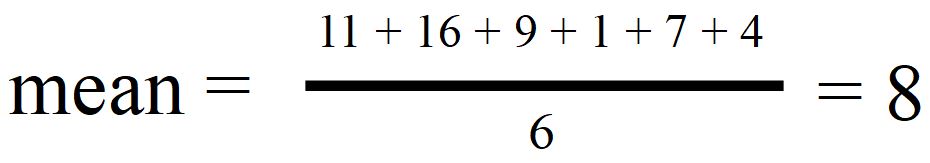
The mean, or average of the numbers, is 8.
But what good is it?
Here are a couple of examples:
Take a close measurement of something, such as the width of a sandwich.
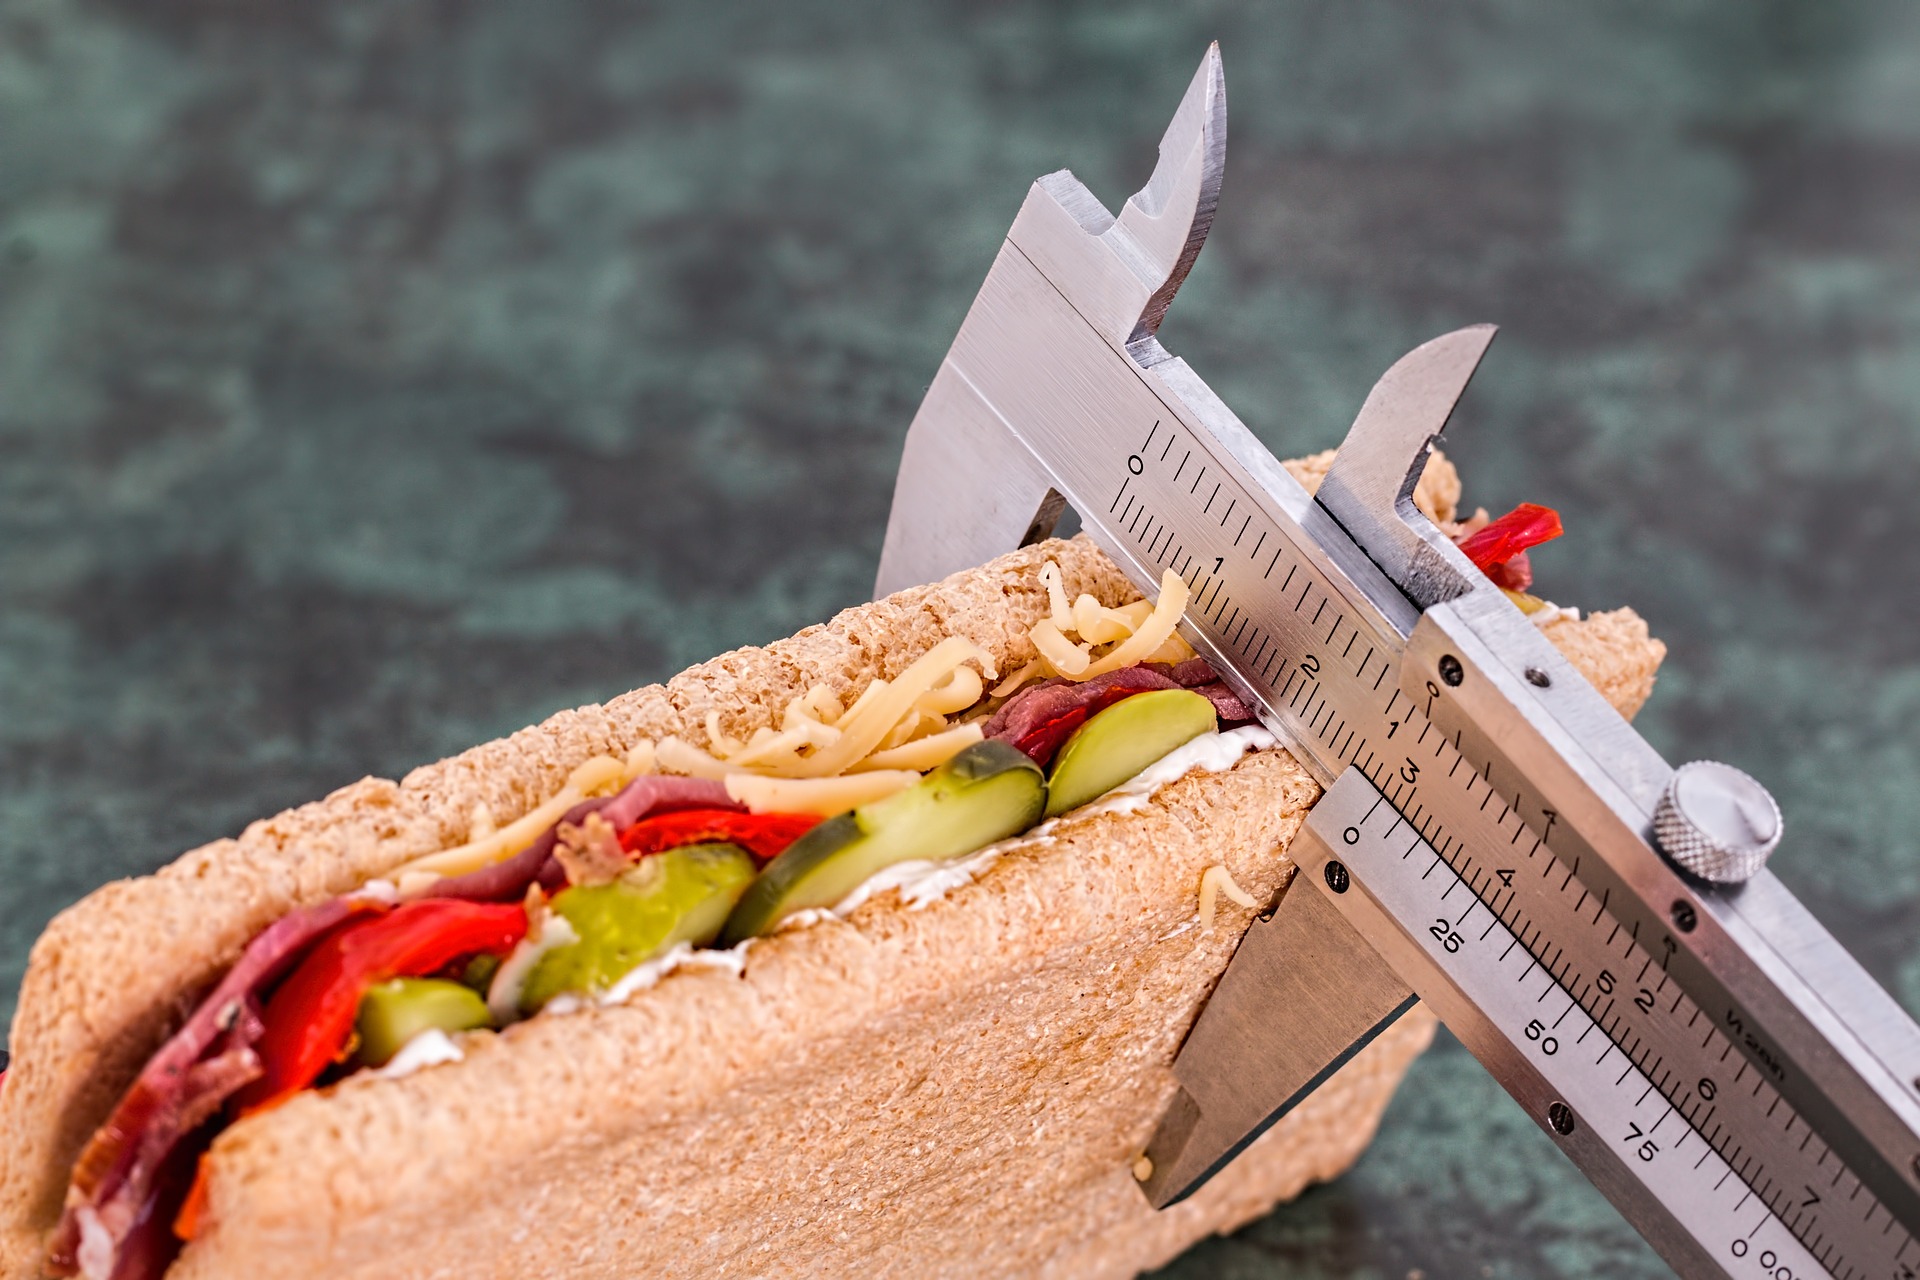
If you take a measurement of it several times, you might get slightly different results. That being the case, what is the best answer that can be given for its width? Going with the best, correct answer (we suppose) use the middle, or average, of your measurements as your answer.
Going with the above, sometimes the average is considered "normal" or "typical." Of course, this assumes no real variation between objects, so the average must represent all. For example, if at Big Bob's Monster Sandwich Shoppe they take repeated measurements of the width of their Biggie Sandwich. The average can then be taken as its typical width.
The problem is, averages are applied to many things that vary. Examples include the average income, the average weight, the average age that a child learns to do such and such. In such cases, what does the average truly tell?
The value of statistics is as a tool to help us understand the world better.
And in so doing, we become wiser as well.
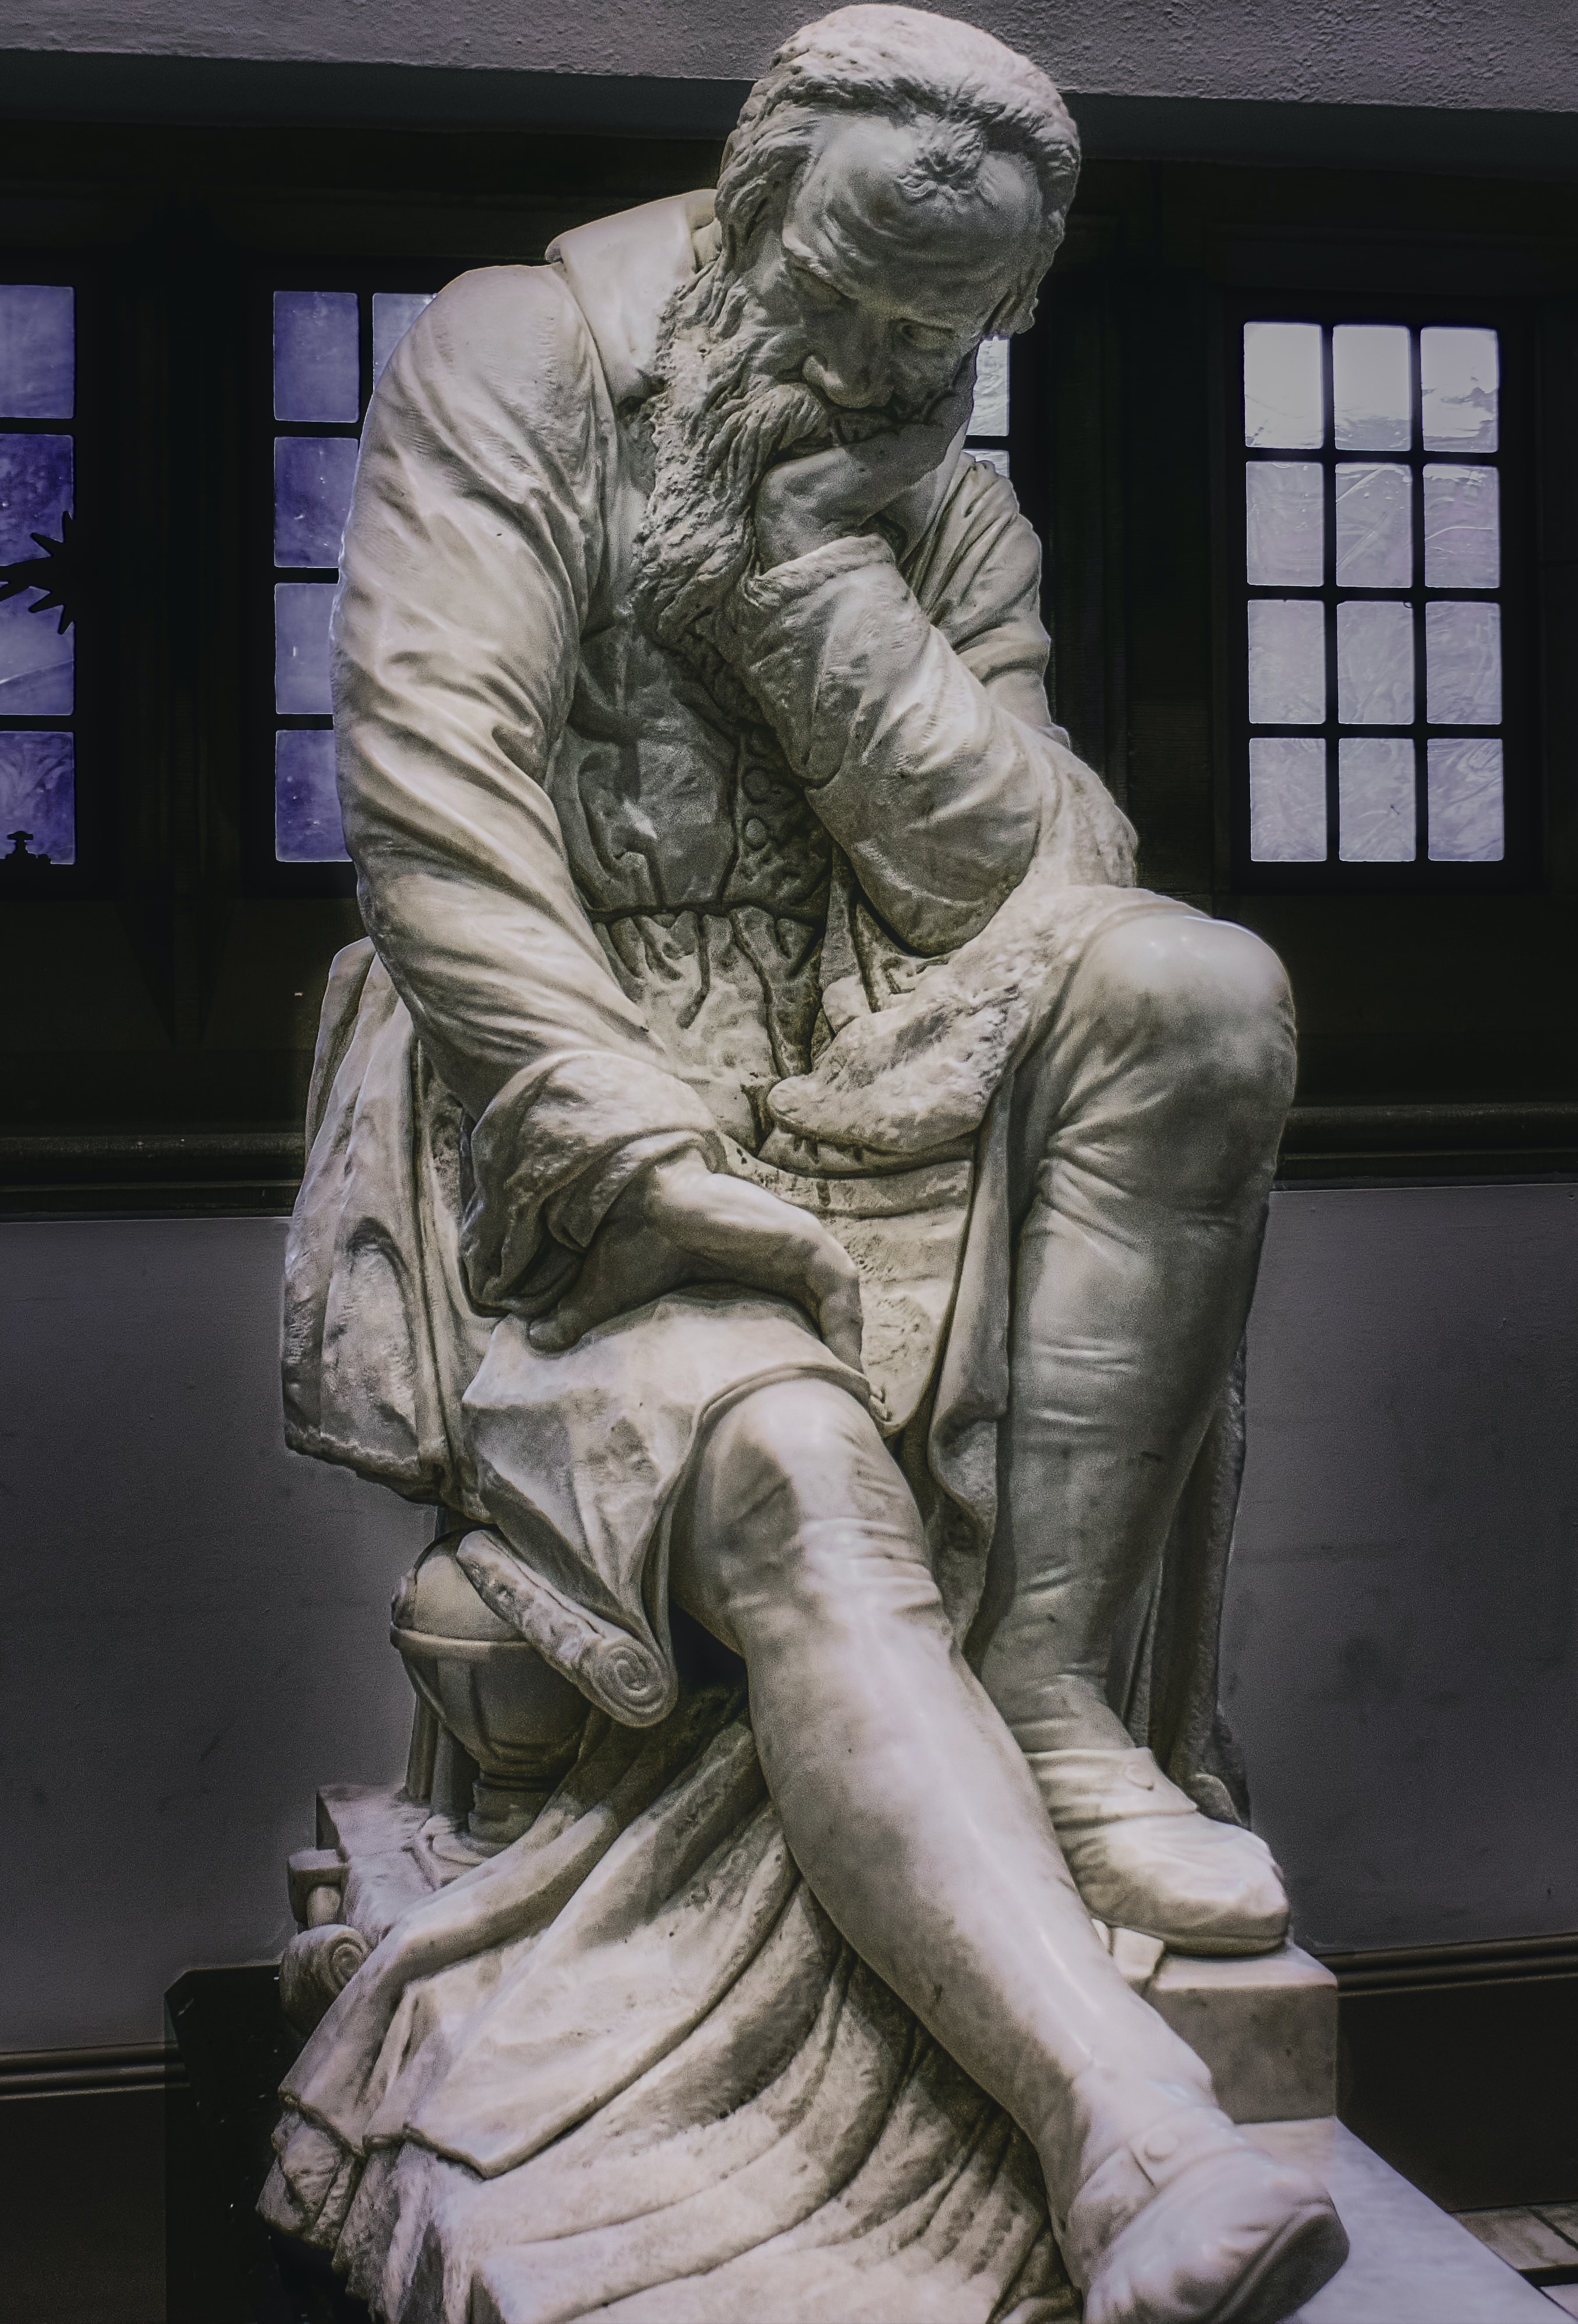
Sculpture of Galileo Galilei contemplating the nature of the universe.
Great books
How to Lie with Statistics
OK, the title sounds disreputable, but it's actually a fine book. The author goes through various techniques used by people to lie with statistics—a very informative book.
Don't miss out on future posts! Sign up for our email list and like us on Facebook!
Check out more hot topics, go back to Home Page

Comments? You can contact me at mailbox@thehomegrownprofessor.com